Artist Networks
We analyse the Et dukkehjem records in IbsenStage as networks of events linked by participating artists. Partcipating artists are contributors to events with functions other than translator, playwright, composer, adaptation, and author.
As artists move from production to production, we trace how their trajectories link events into networks. Network visualisations indicate lines of descent from the earliest productions, clusters of closely related productions, isolated areas of production activity, and breaks in transmission.
The networks on this page visualise subsets of Et dukkehjem event records in IbsenStage from 1879 to 2015. The data set was exported from IbsenStage on 31 October 2015. Visualisations were created with Visone.
Et dukkehjem events linked by artists
This network shows Et dukkehjem events from 1879 to 2015 linked by participating artists. There are 3112 events in this network linked by 3903 participating artists. Events that are not linked by participating artists are not included. The network has been simplified for display on this page. It is also available as a high-resolution colour image with labels in pdf format [12.4 mb].
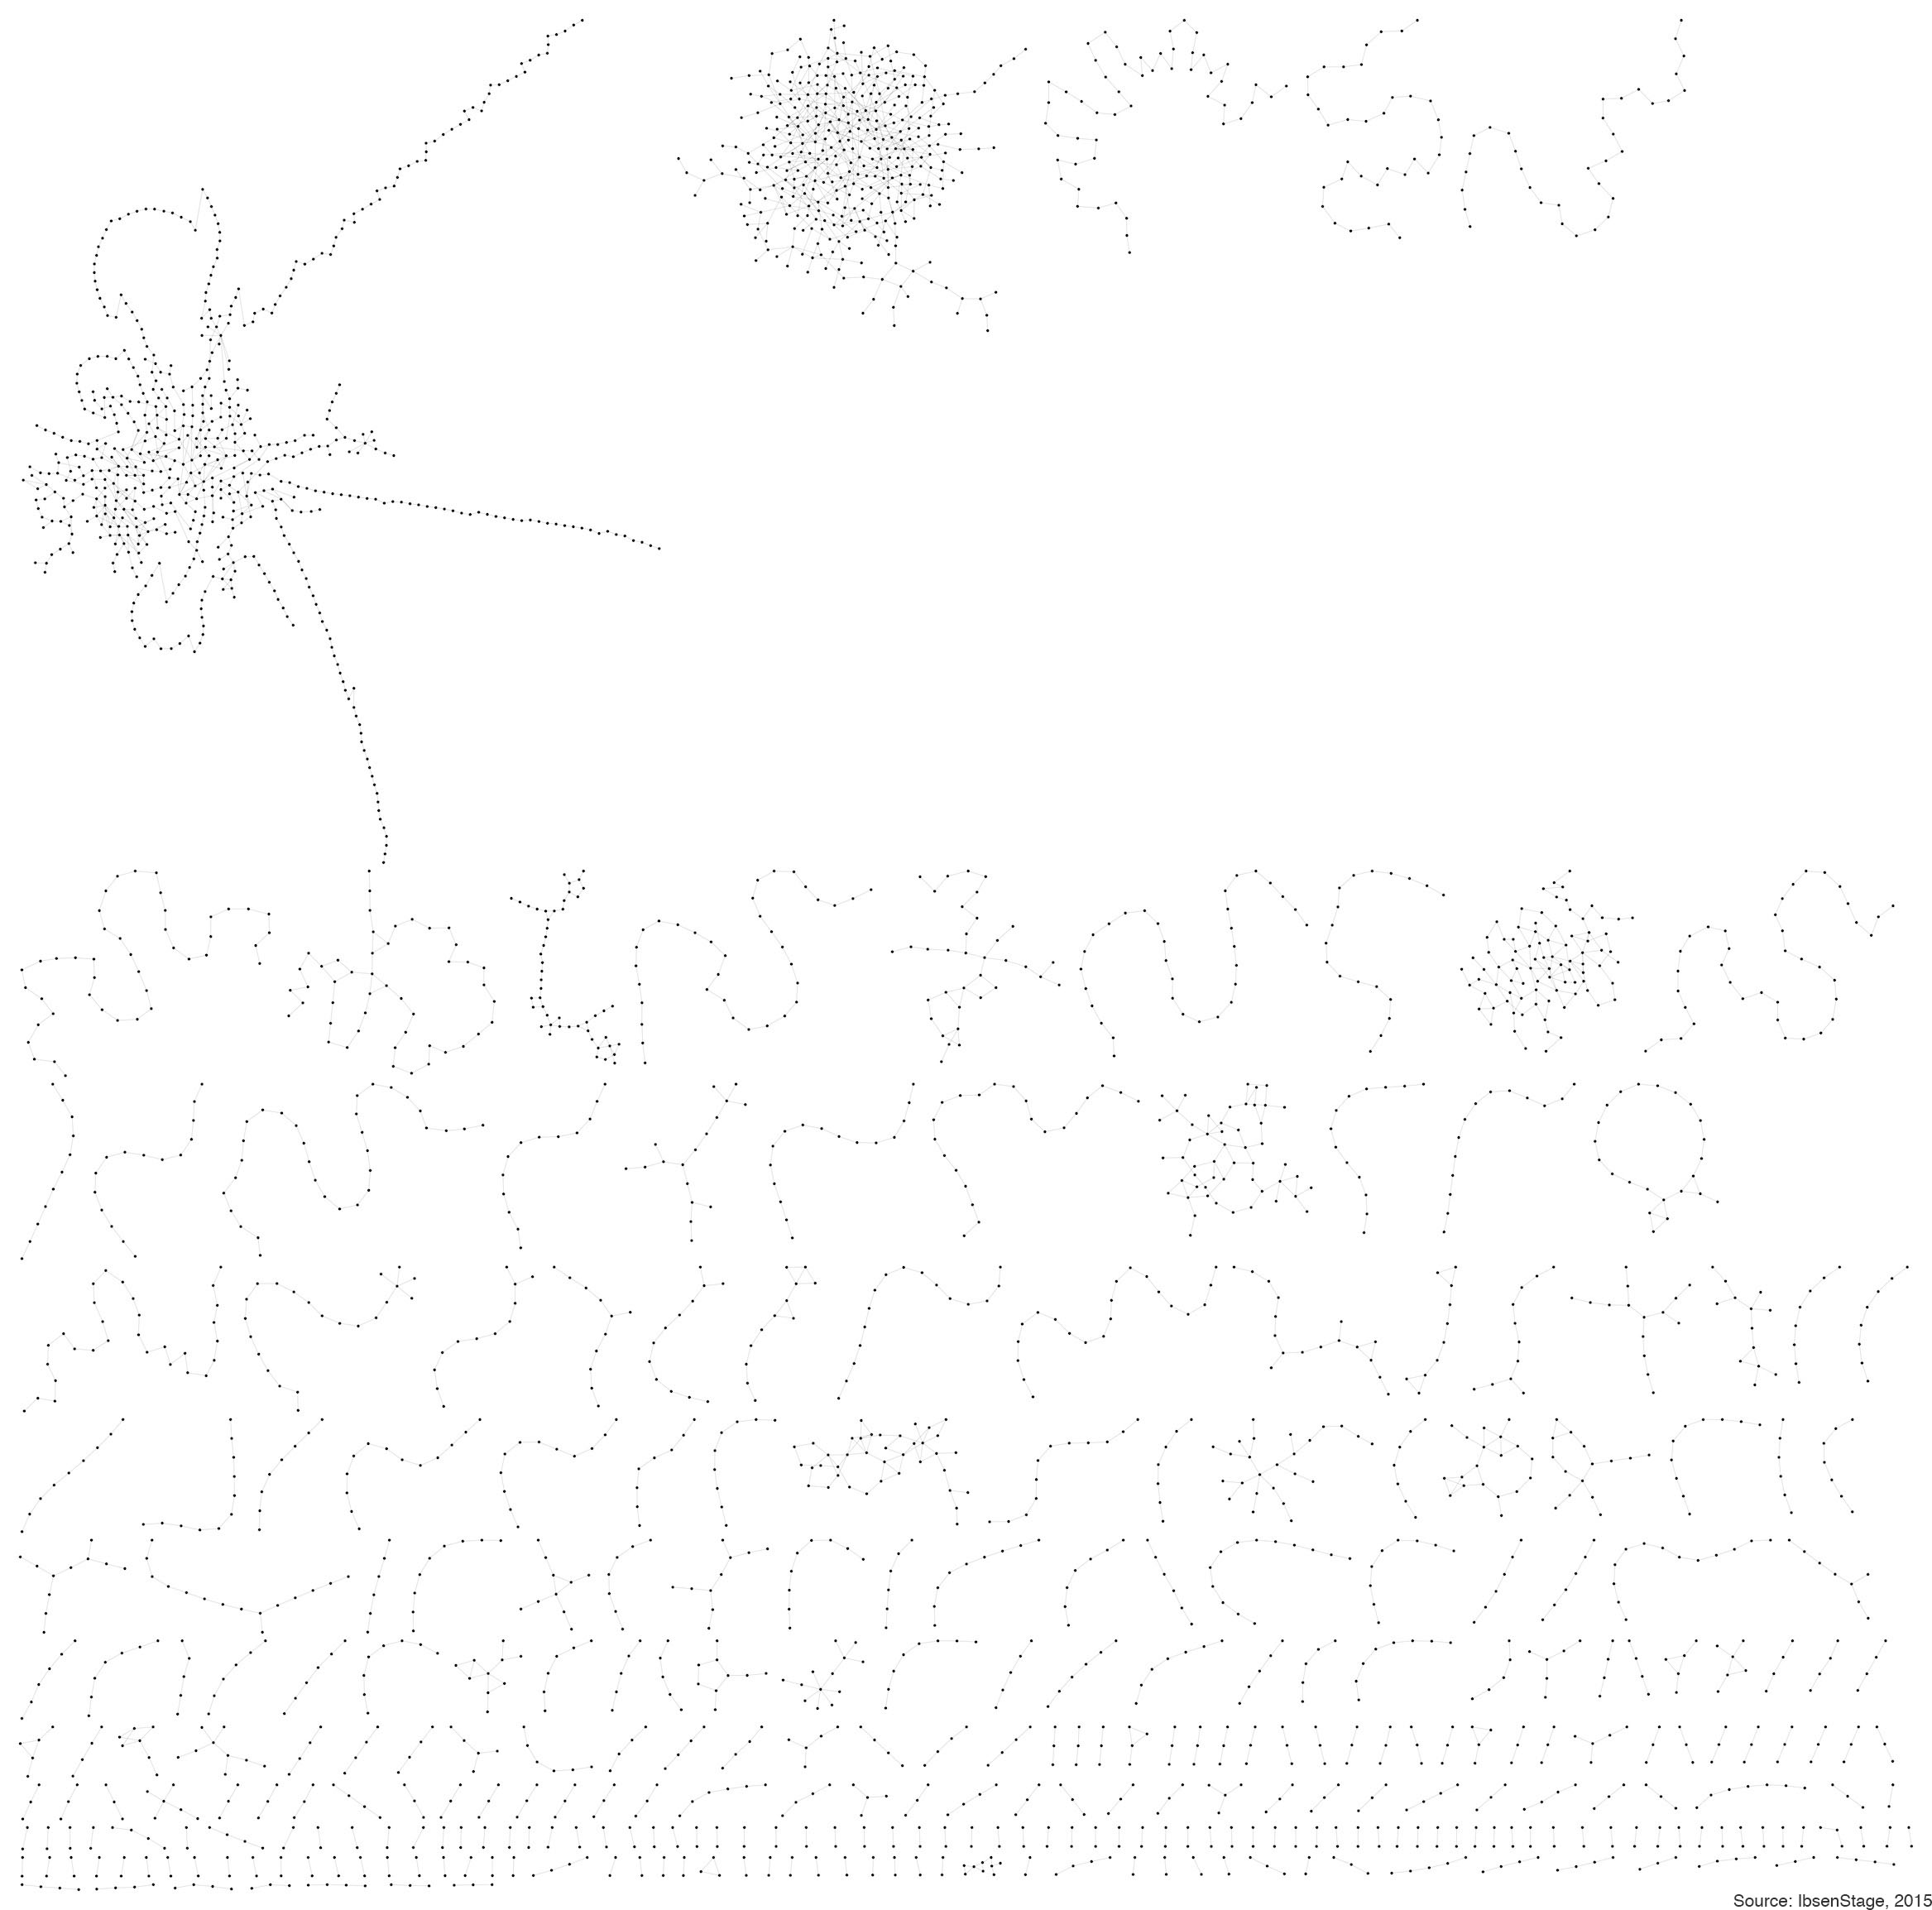
Et dukkehjem events linked by artists in clusters of 10 or more events
This network shows Et dukkehjem events from 1879 to 2015 linked by participating artists into clusters of 10 or more events. There are 2202 events in this network linked by 2147 participating artists. It has been simplified for display on this page. It is also available as a high-resolution colour image with labels in pdf format [8.9 mb].
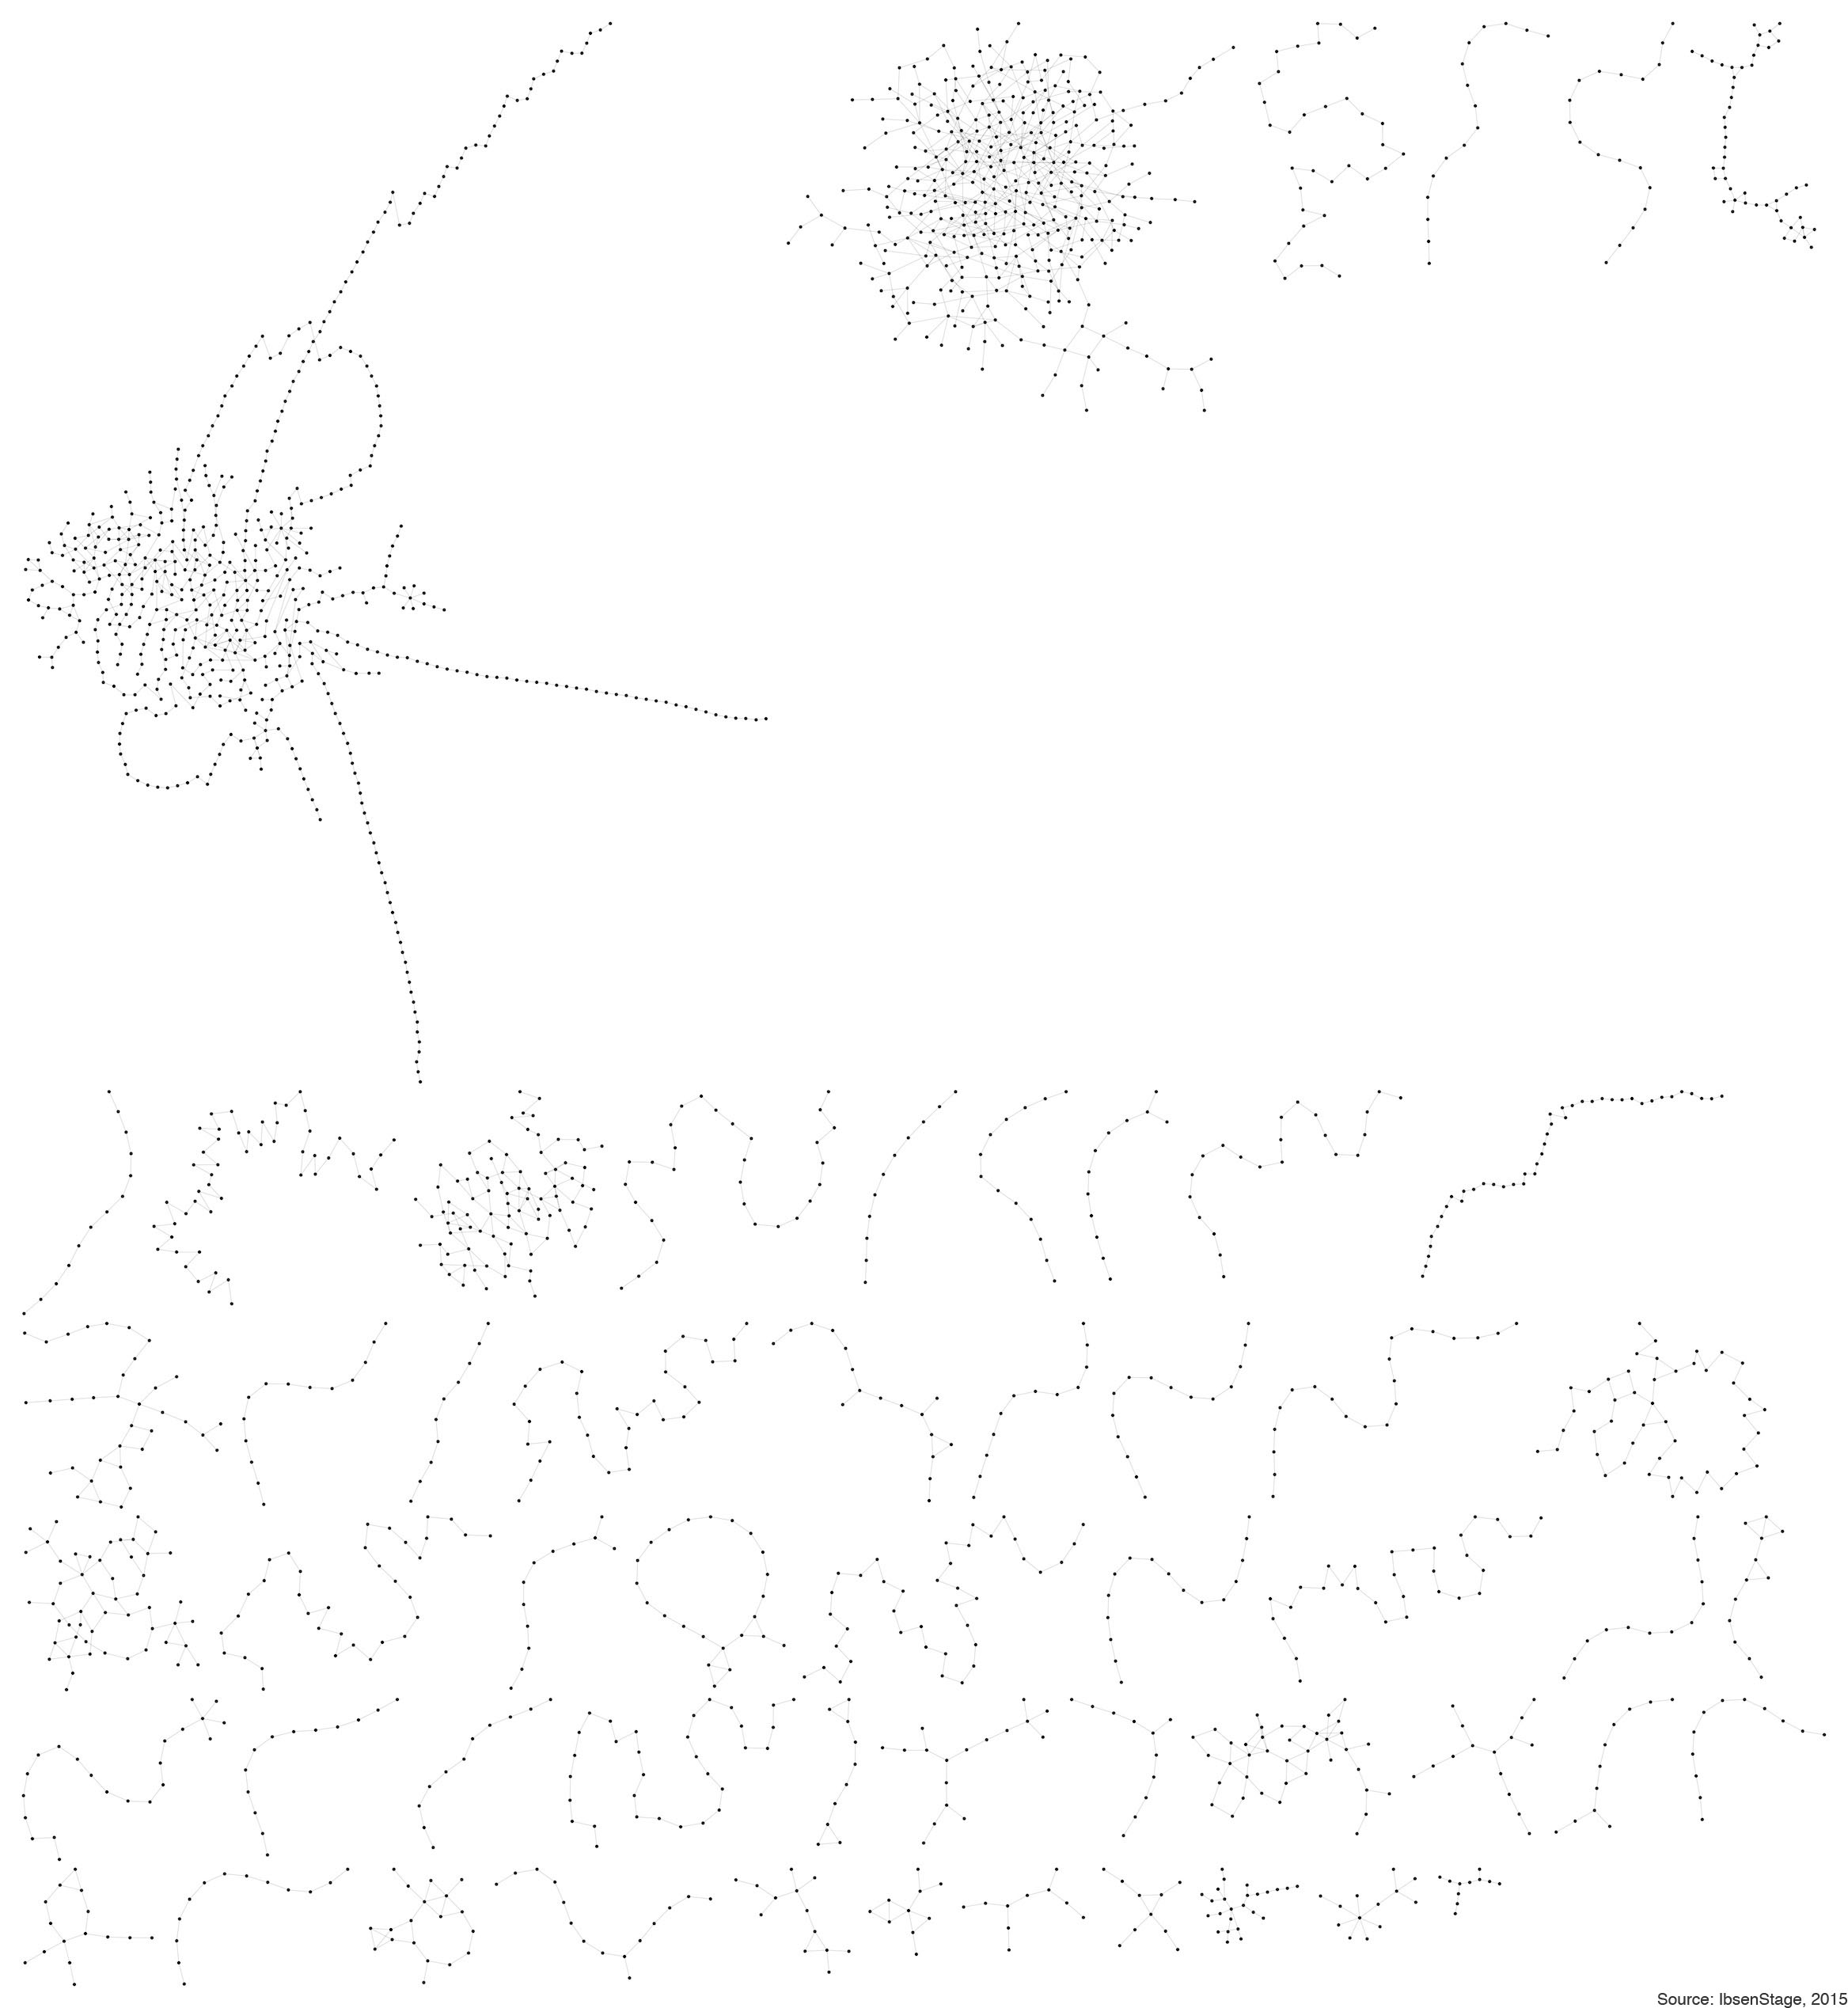
Et dukkehjem events linked by artists in two major clusters
This network shows Et dukkehjem events linked by participating artists into two major clusters. On the left is a cluster of mostly Nordic productions, with touring productions appearing as long strands of events. On the right is a cluster of mostly German-language production. The events are from 1879 to 2014; no events in 2015 were linked to these clusters. This network has been simplified for display on this page. It is also available as a high-resolution colour image with labels in pdf format [4 mb].
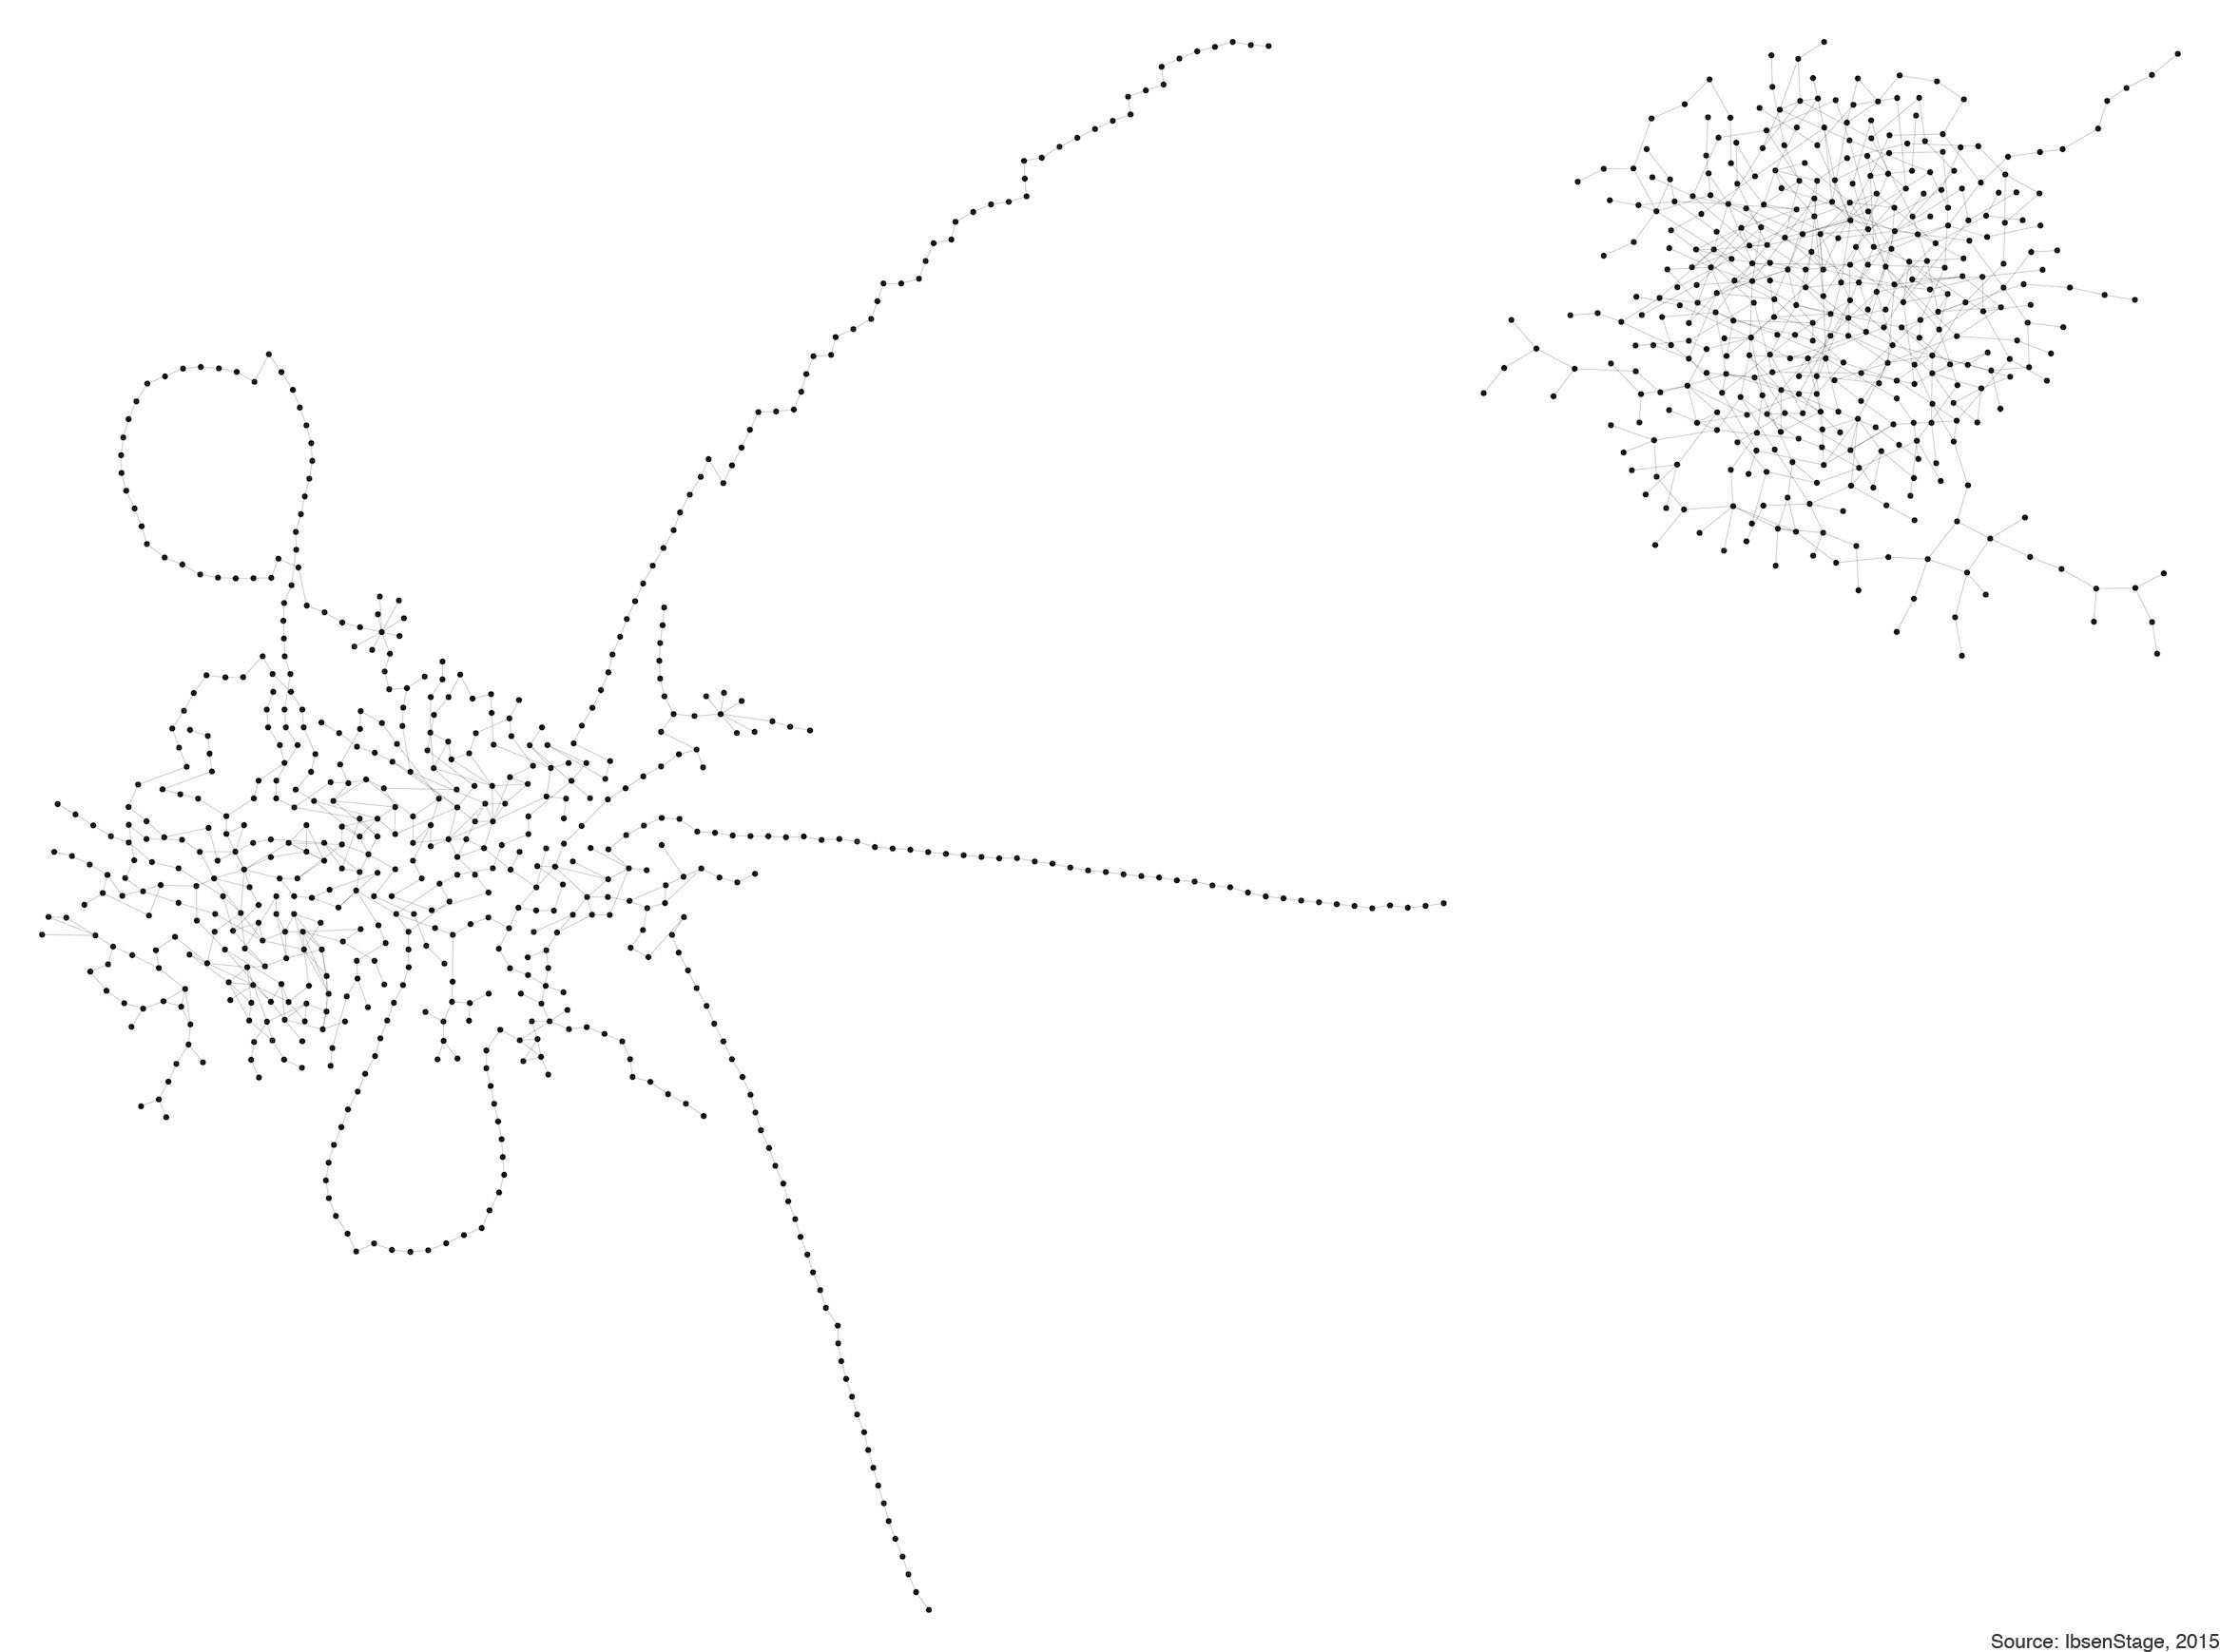
Et dukkehjem events linked by artists in smaller clusters
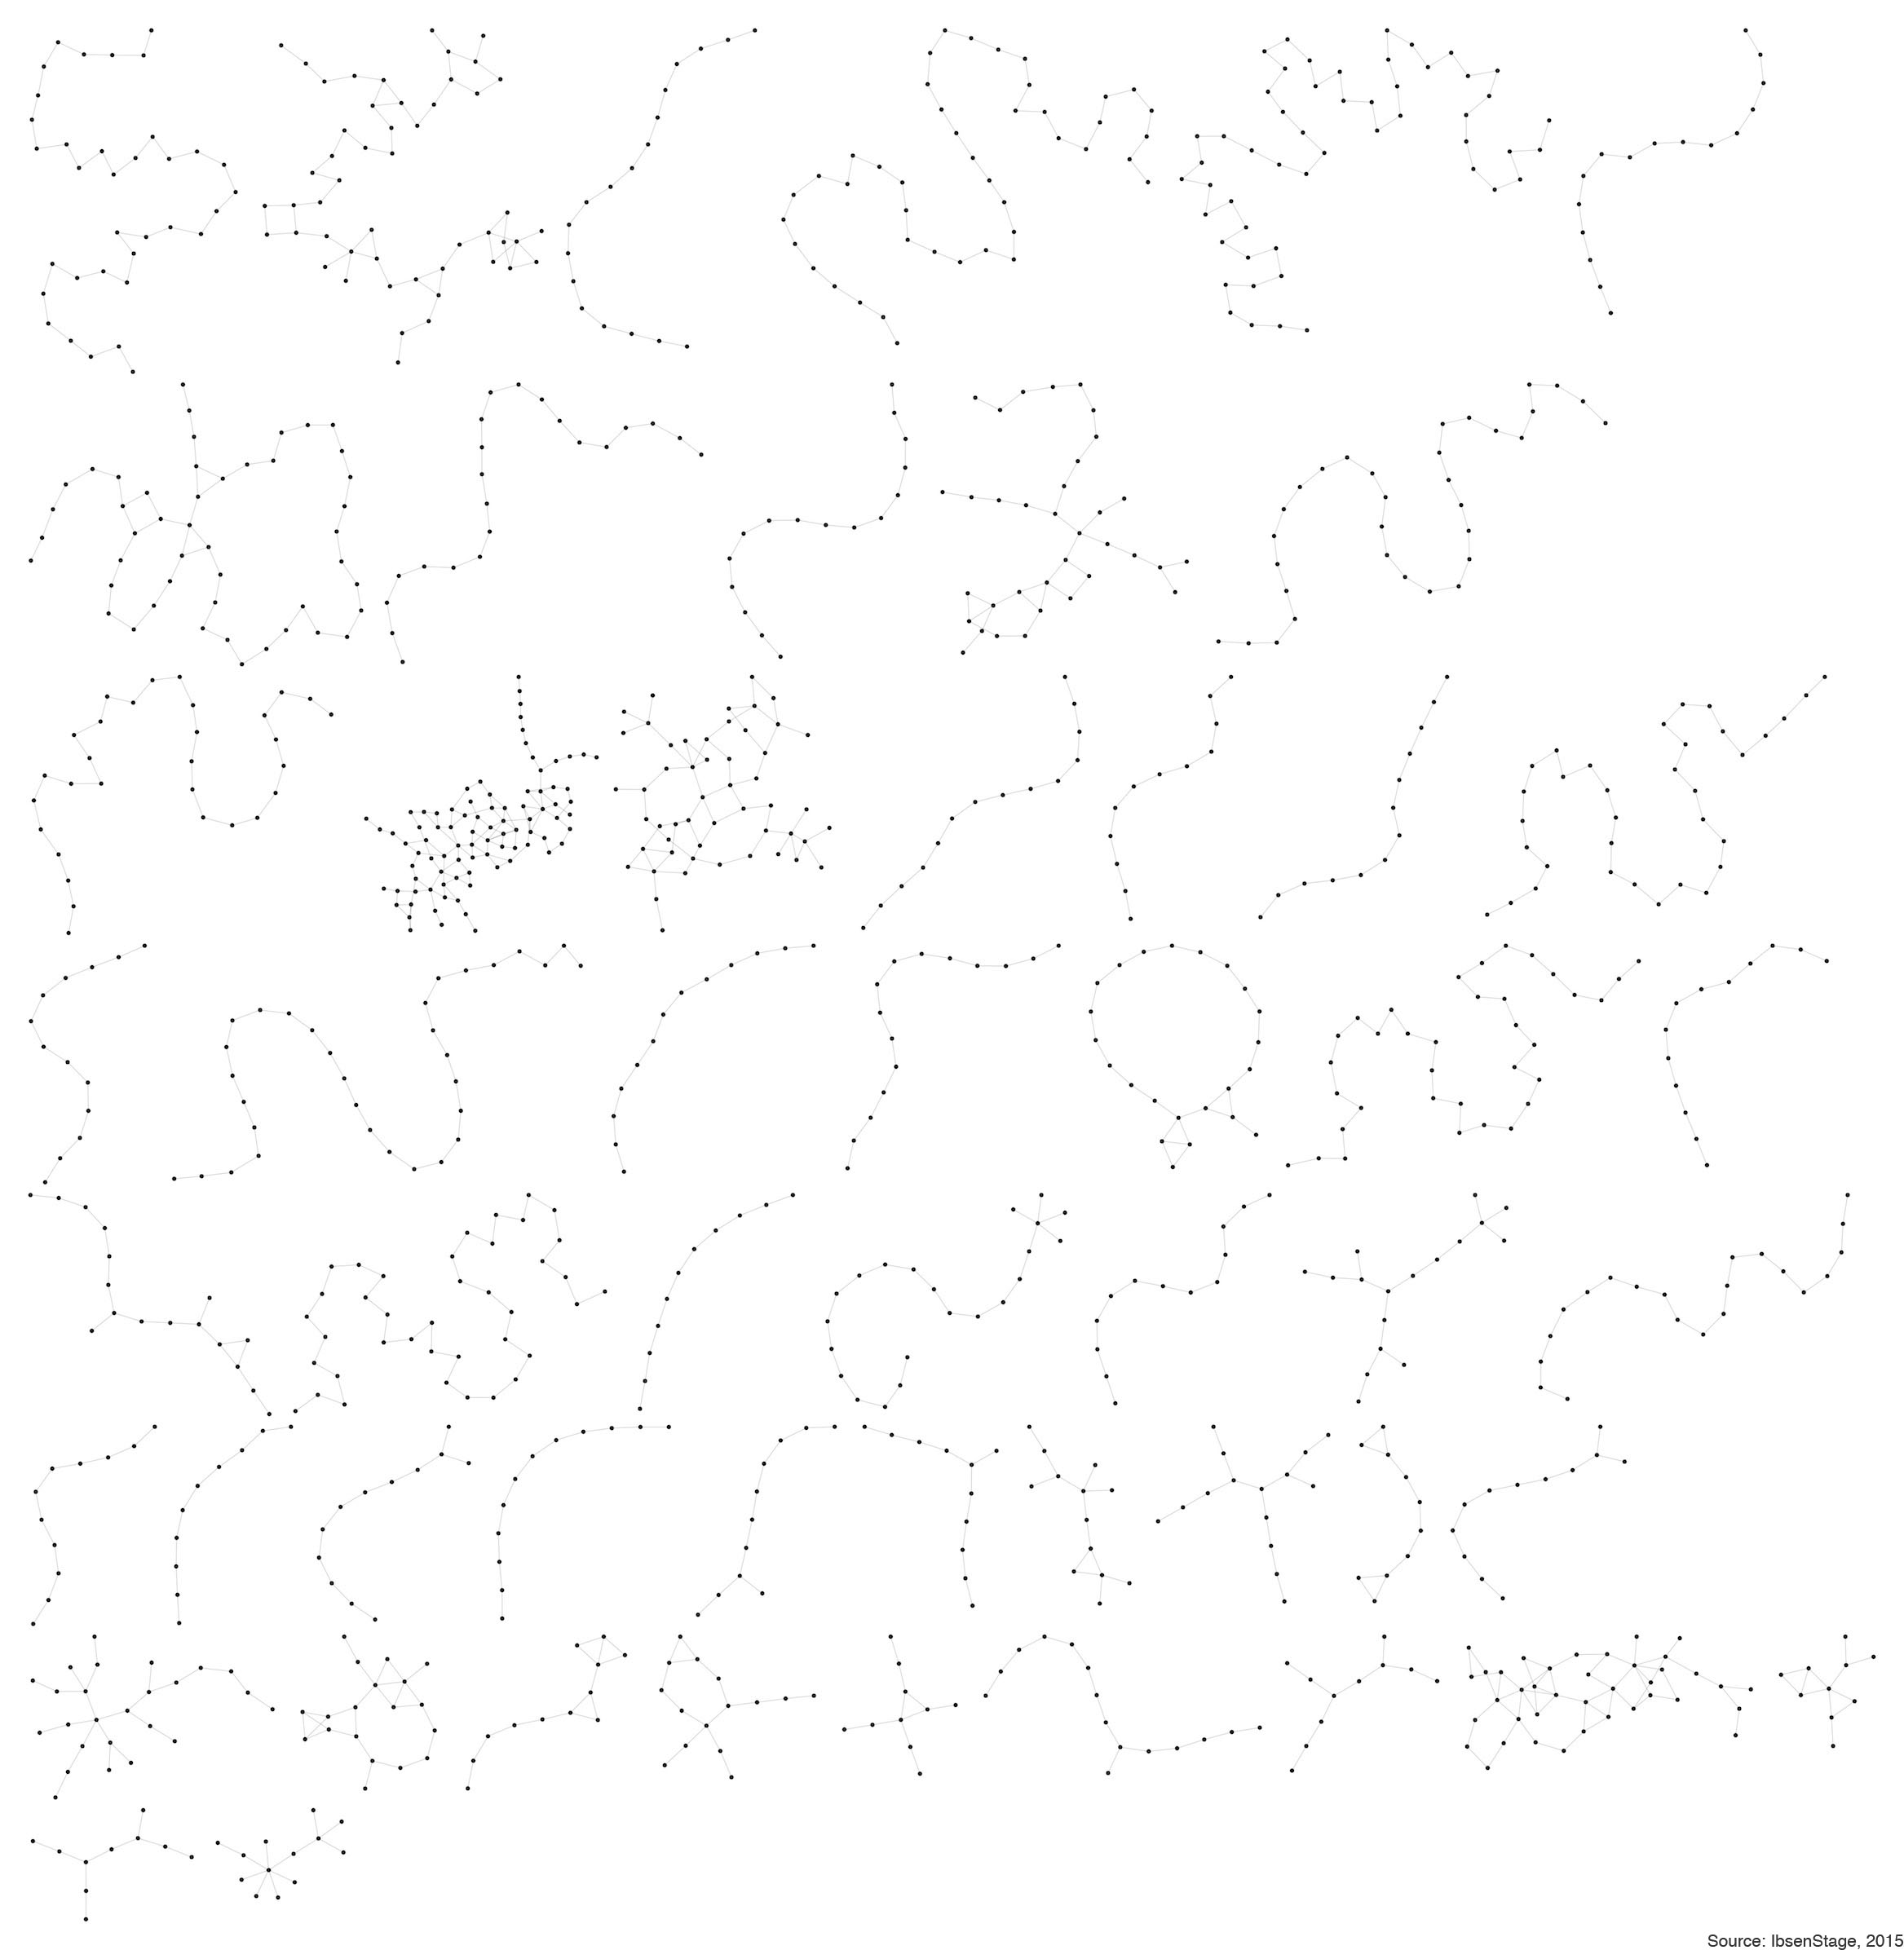
This network shows Et dukkehjem events linked by participating artists into 53 smaller clusters of 10 or more events. The events are from 1882 to 2015. Events linked in strands are mostly touring productions. The largest cluster of 88 events (centre left) links productions in Greece from 1899 to 1975. The adjacent cluster of 52 events links productions in Poland, Russia and Ukraine from 1882 to 1946. This network has been simplified for display on this page. It is also available as a high-resolution colour image with labels in pdf format [4.8 mb].
‘Nordic’ cluster of Et dukkehjem events linked by artists
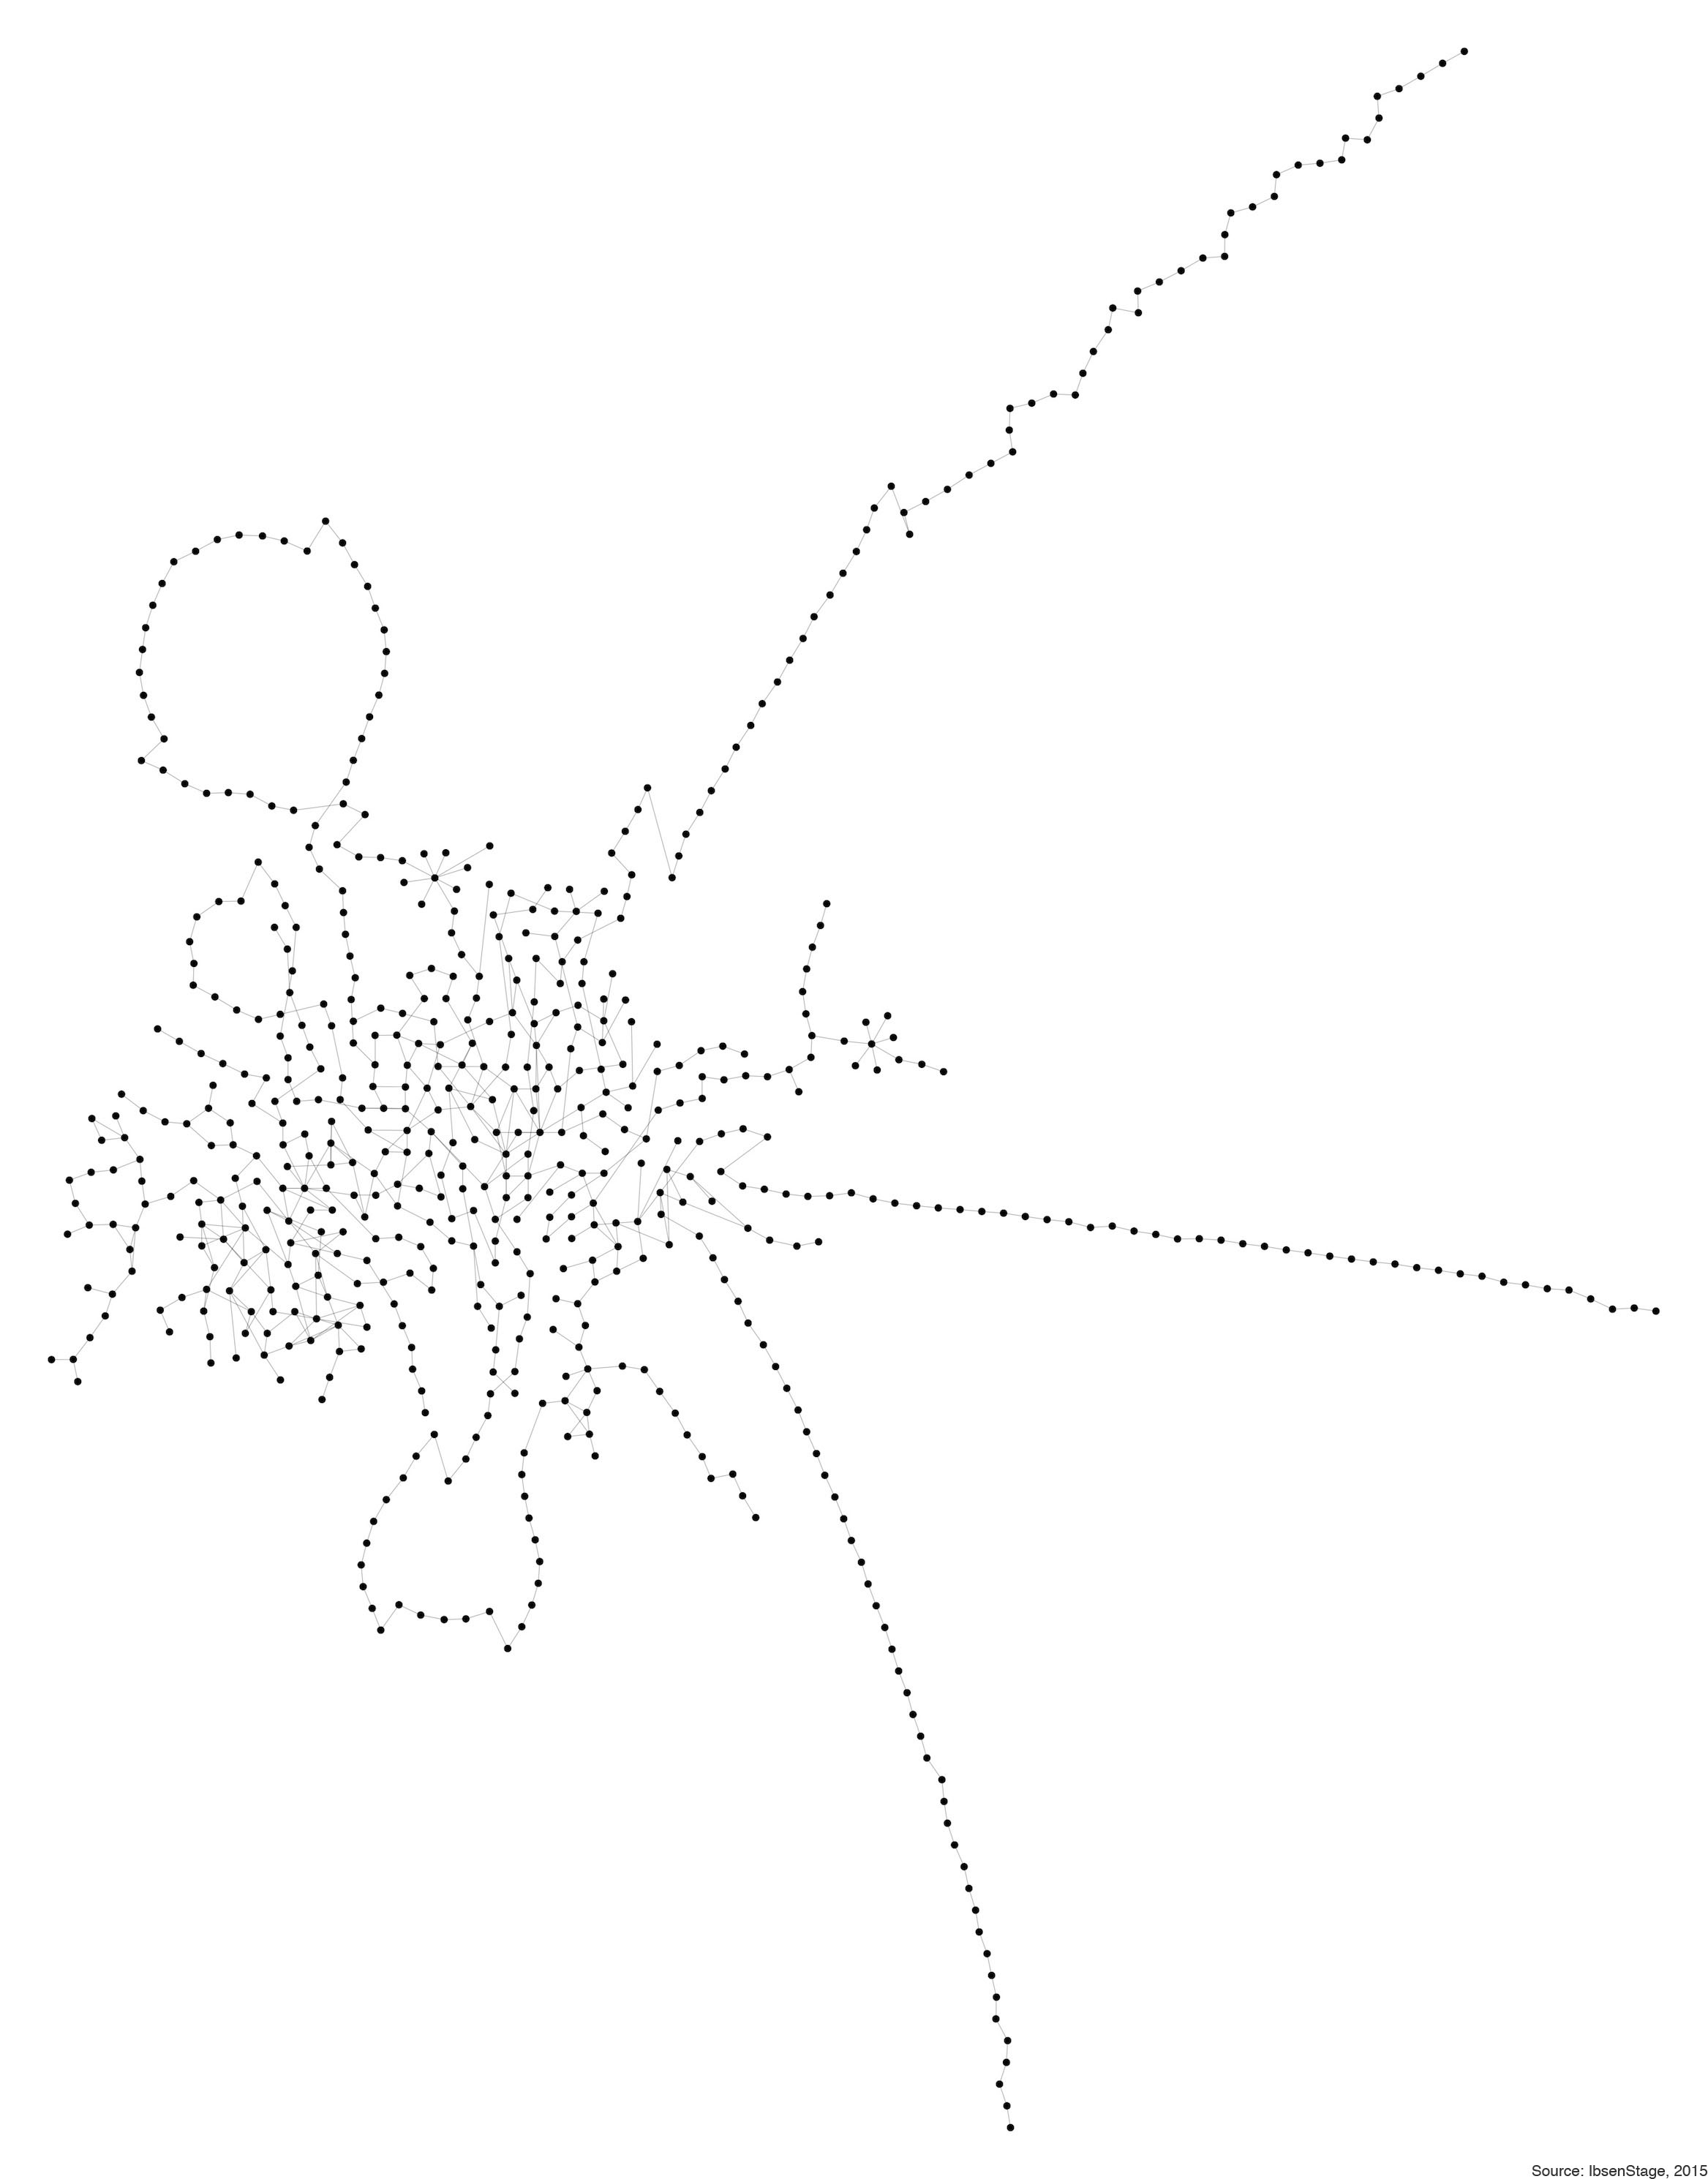
This network shows the major cluster of mostly Nordic productions linked by participating artists. There are 630 events from 1879 to 2014 in this cluster. These events are linked by 580 artists. Touring productions appear as long strands of events. The cluster mostly links productions in Norway, Sweden, Denmark, Finland, and Iceland. These Nordic productions are also linked by artists to productions in Europe, America and Asia. This network has been simplified for display on this page. It is also available as a high-resolution colour image with labels in pdf format [2.6 mb].
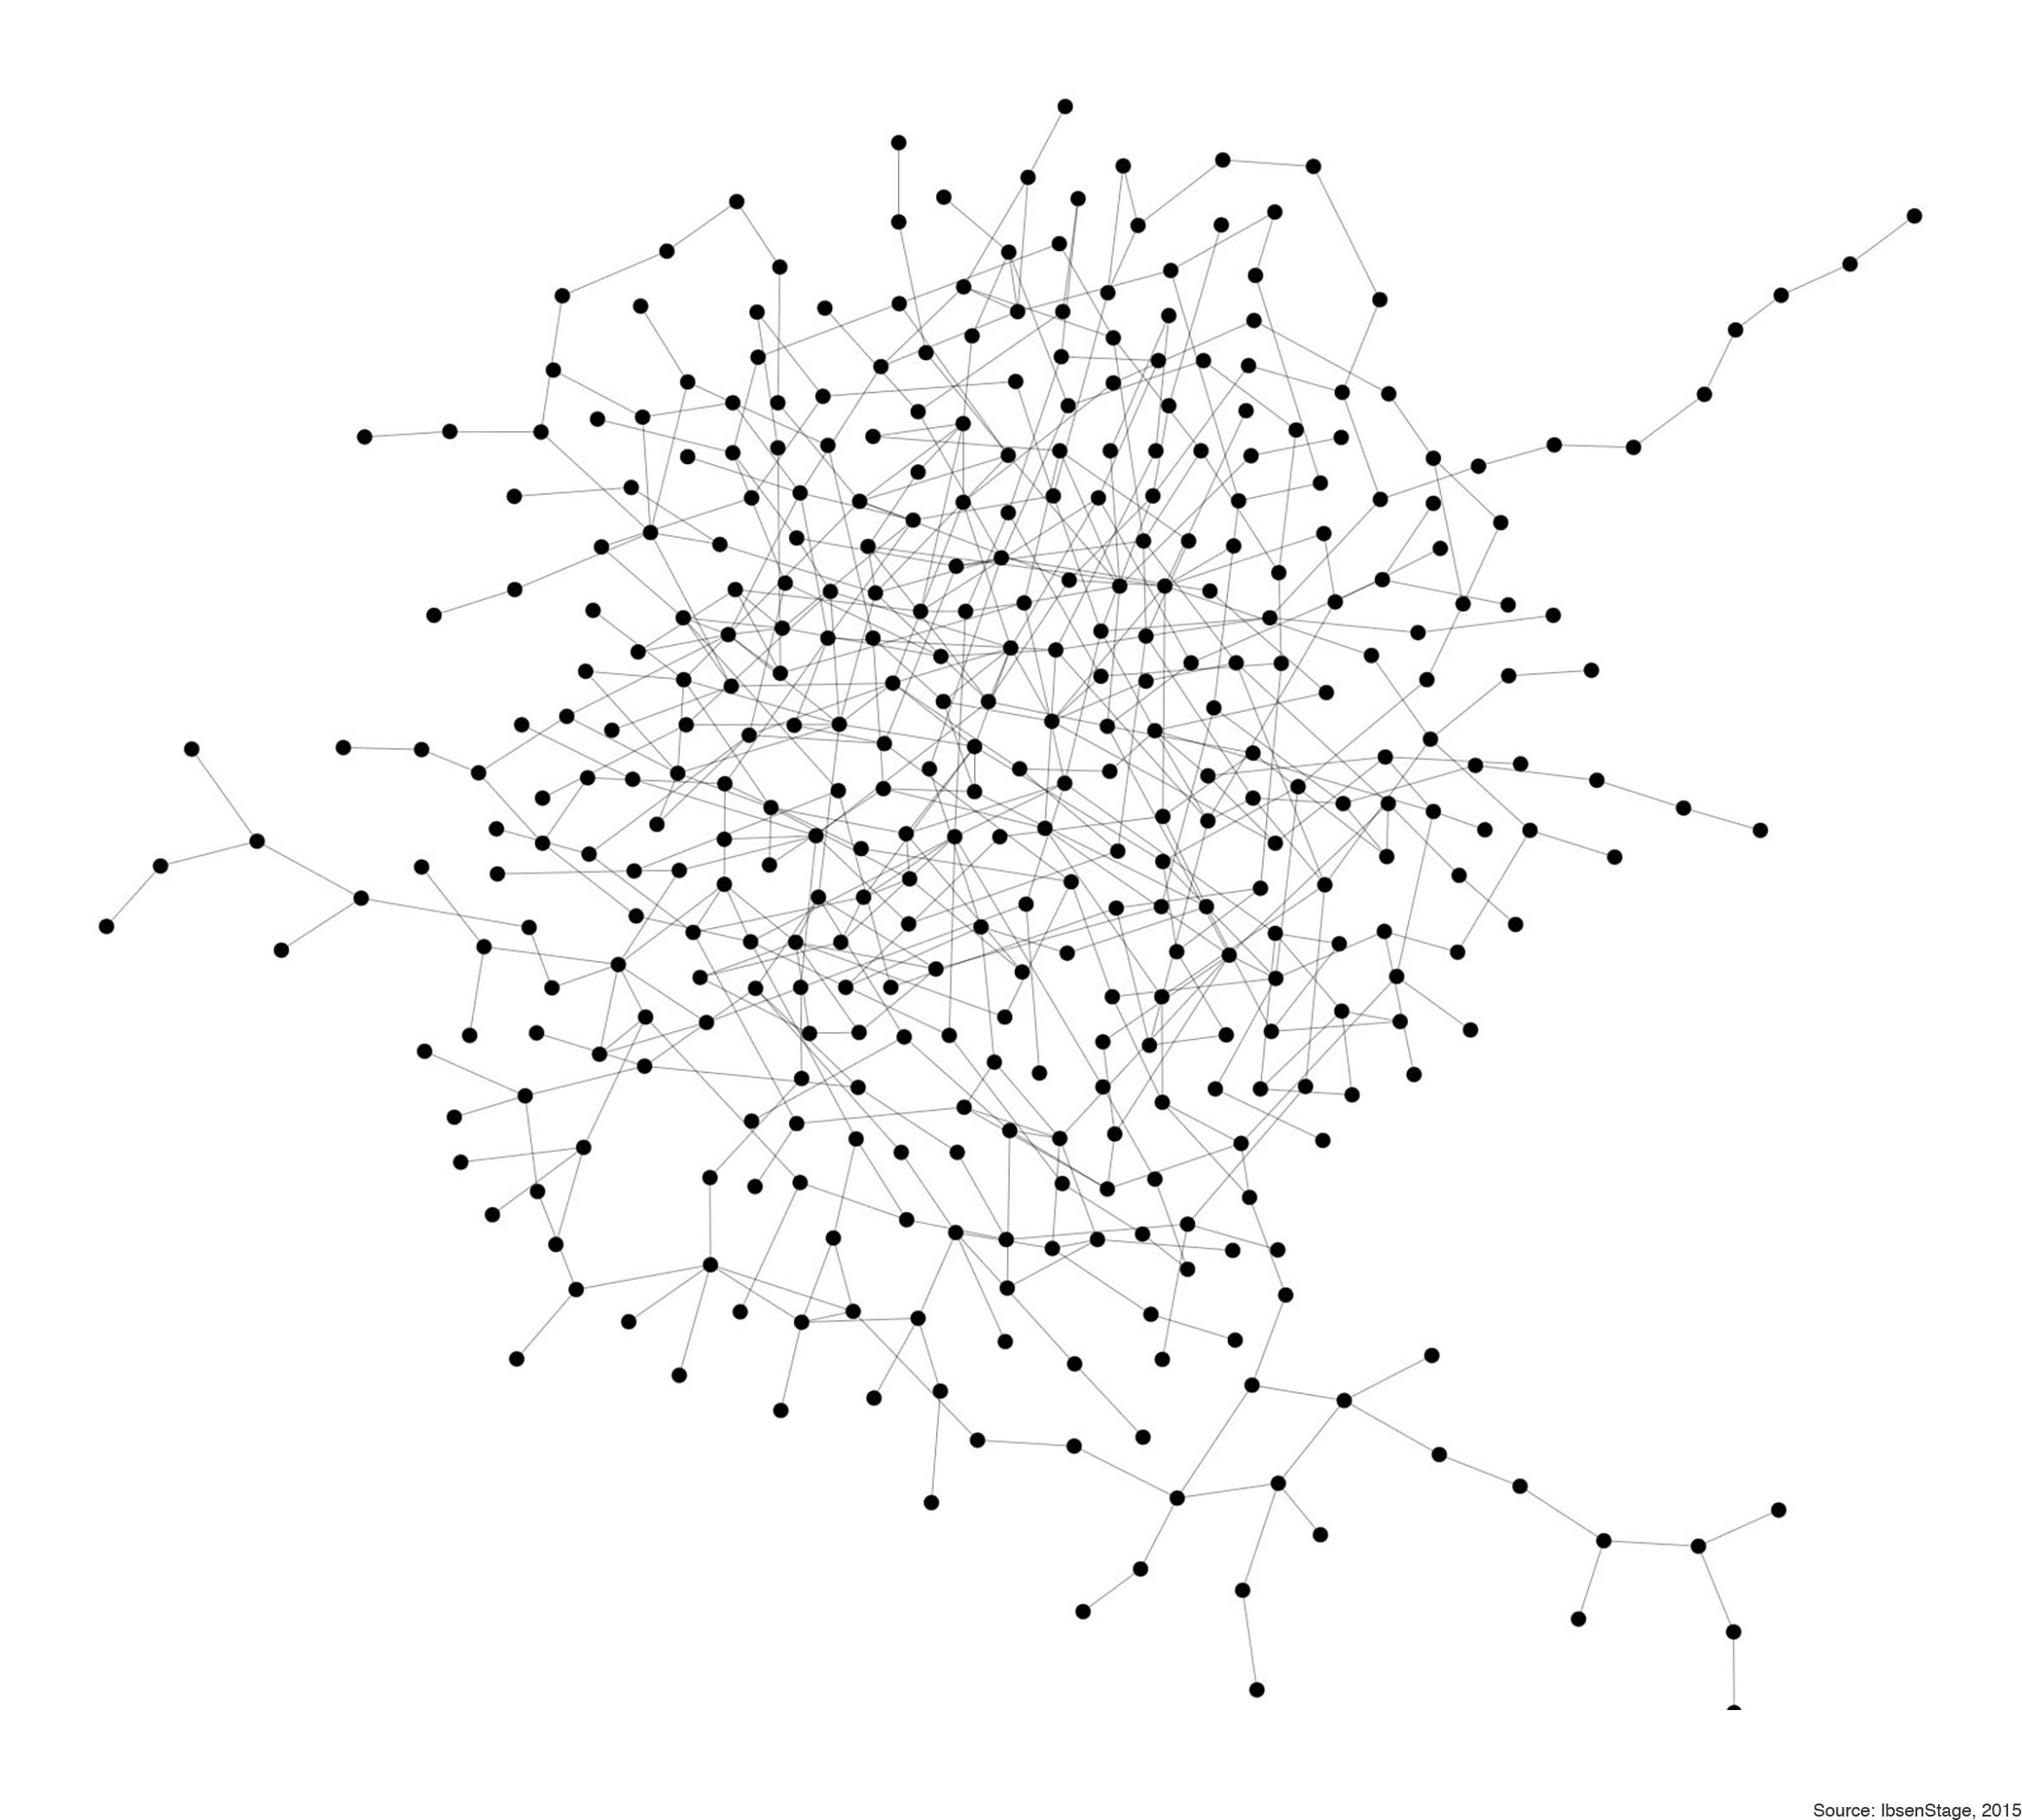
‘German’ cluster of Et dukkehjem events linked by artists
This network shows the major cluster of mostly German-language productions linked by participating artists. There are 383 events from 1880 to 2004 in this cluster. These events are linked by 568 artists. The cluster is focused on events in Germany. It also includes events in Austria, Switzerland, Poland, Czech Republic and the United States. It has been simplified for display on this page. It is also available as a high-resolution colour image with labels in pdf format [1.4 mb].
