 A Global Doll’s House: Ibsen and Distant Visions
A Global Doll’s House: Ibsen and Distant Visions (Palgrave Macmillian, 2016) is the first research publication to make extensive use of the IbsenStage database.
The aim of this project site is to display the data visualisations associated with the research for this book. When looking at the visualisations, viewers need to be aware that our data set, though extensive, is still not complete. It will continue to grow, not just with records of future productions, but with records of past performances still to be collected. Data export dates are provided with each visualisation.
Three approaches were crucial to the research methodology that we used to answer a deceptively simple question: What accounts for the global success of A Doll’s House? The approaches were the generation of frequency lists, maps displaying touring productions identified by the actors performing Nora, and network graphics showing the links created between production events by participating artist.
 Data Overview
There were 3787 records of Et dukkehjem (A Doll’s House) events recorded in IbsenStage when the project completed its analysis in October 2015. The first series of visualisations provides an overview of the data set.
Global Tours
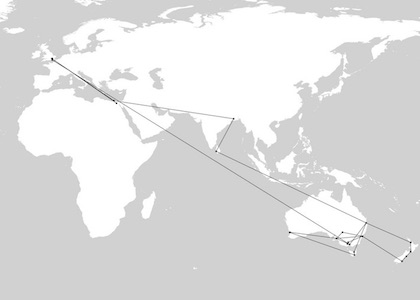 Visualising the production data on Et dukkehjem as a series of maps, we investigated the global transmission of the play to investigate the forces that have maintained it as a world drama. Our interest lay in performances of Et dukkehjem rather than distribution via the book market. We concentrated on cultural transmission by artists across space and time: groups of artists travelling together in global touring productions, and individual artists moving between productions over the length of their careers.
We used maps to visualise the major distribution routes used by artists to tour productions. We looked at the movements of 16,074 artists to find those connected with performances in three or more countries. This process identified 568 key individuals and the touring locations of fifty-six Noras. Four maps display this history of global touring.
Nordic Maps
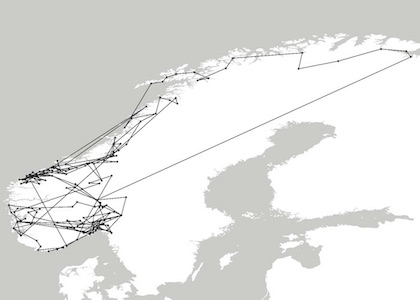 There are 825 events and 2,268 participating artists recorded in the IbsenStage Nordic Et dukkehjem dataset. While the early European Noras were circling the globe, the Nordic Noras were creating a performance tradition. In the years immediately following the world premiere in Copenhagen, the play spread rapidly over the region. Actors were invited to give guest performances as Nora; their interpretative approaches merged to create the dominant Norwegian tradition of performing the play. This tradition was disseminated through touring productions between 1914 and 1990, but this touring pattern changes in the 1990s. Instead of exporting productions of Et dukkehjem, Norway starts to import productions to the International Ibsen Festival; the Norwegian government established a number of international cultural programs that stimulated world production of the play. The Nordic Et dukkehjem story is visualised in three maps.
Artist Networks
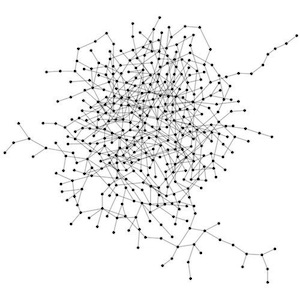 While maps helped us to trace the distribution across space of Et dukkehjem in performance, network analysis enabled us to chart aesthetic transmission through time. As theatre is a collaborative art form, complex interconnections between artists working on diverse projects are commonplace, but artists connected to multiple productions of the same play are harder to find.
A network analysis of the whole Et dukkehjem production history (excluding contributors with writing and translation credits) revealed that of the 15,571 participating artists, 6,133 (39 percent) were connected to clusters of ten or more events. This was an extraordinary degree of interconnection to discover within the production history of a single play. The two major clusters were linked primarily through Nordic productions and German language productions. Although both clusters included productions from beyond Europe, they were not connected by any participating artists. A number of small clusters centred around productions from Italy, Greece, and Eastern Europe.
The uncovering of such rich artistic interconnections in the history of Et dukkehjem implied that knowledge transmission between artists about the production history of the play was widespread; it further suggested that other canonical works of modern drama might be subject to a similar form of theatrical inheritance. These clusters are displayed in a series of six network visualisations.
 Performance Tradition
By combining our analysis of the Nordic touring maps with an investigation into the artistic links in the Nordic network cluster, we were able to uncover the emergence, consolidation and eventual decline of an Et dukkehjem performance tradition.
The rich interconnections within the cluster suggests that knowledge from previous performances was readily available in Nordic rehearsal rooms. By following the links, we were able to identify the artists who created the tradition in the late nineteenth century, and those who consolidated it with their touring productions in the twentieth century.
Four major lines of artists link the premiere of the play in Copenhagen in 1879 to performances in the early 1990s. These lines are shown on a series of four visualisations. Two maps show the trajectories of these key artists linking Nordic productions. A network graphic shows these same links as a line of transmission through these events. And a diagram identifies the actors playing Nora and the major linking artists within this tradition.
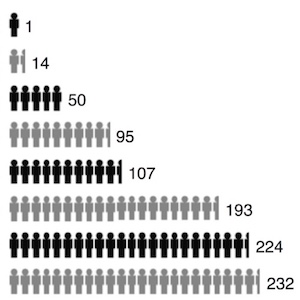
Frequency Lists
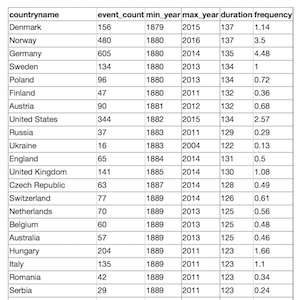 Throughout our research we generated frequency lists of data records. We identified the frequency of productions by country, venue, and participating organisation.
More complex queries identified the numbers of performances given by actors in specific roles within particular countries; or the numbers of countries in which actors had performed the play. We explored the contributor functions listed in the production records to ascertain the shift in nomenclature used to credit participants within theatre production, particularly the shift from translator to adaptor.
The frequency lists helped us to identify sub-sets within Et dukkehjem data that were crucial to our choice of data visualisations. Seven frequency lists are reproduced here. Since the final export of data used to create the visualisations for A Global Doll’s House, additional records have been entered into IbsenStage.